
The NCUA developed the Simplified CECL Tool (CECL Tool) to assist smaller credit unions with developing their allowance for credit losses (ACL) on loans and leases as required under the accounting standard for the current expected credit loss (CECL), Accounting Standards Codification (ASC) Topic 326, Financial Instruments – Credit Losses.
The CECL Tool is intended for use by credit unions with under $100 million in assets, although it could be used by larger credit unions based on the discretion of their management and auditors.1 Because not all credit unions are the same, the CECL Tool includes functionality for a credit union to calibrate assumptions to its circumstances.
While a variety of credit loss methodologies are permissible under CECL, the NCUA chose the Weighted Average Remaining Maturity (WARM) method under the expected loss rate approach as the model methodology for the CECL Tool. The Financial Accounting Standards Board (FASB) indicates the WARM method is intended for use in estimating the ACL for less complex entities or those with less complex financial asset pools. As stated in a FASB Q&A on the applicability of the WARM method, “There is no expectation that a less complex entity should have to implement a sophisticated model to satisfy the requirements of [Accounting Standard] Update 2016‑13. If an entity is using a loss rate-based method today, that entity may continue with a comparable method, including the WARM method.”2
Accordingly, the WARM method within the CECL Tool uses current loan balances, historical annualized charge-off rates over a specified lookback period, and the estimated remaining life for each segment to estimate the ACL for pooled loans, subject to any qualitative adjustments to the latter two inputs. The ACL for individually evaluated loans is a separate calculation within the Tool.
Model Methodology
What is the Simplified CECL Tool?
The CECL Tool is a Microsoft Excel-based financial model used for estimating a credit union’s ACL under the CECL standard. The CECL Tool uses the WARM method, which leverages both historical net charge-off (NCO) performance data and estimates of weighted average life-of-loan estimates (referred to as WARM factors) to calculate the ACL under the CECL framework. It allows for qualitative adjustments (Q‑factors) to be included to adjust the ACL results to account for a credit union’s unique circumstances or to incorporate adjustments to reflect differing conditions than the conditions implied in the NCO rates and WARM factors.
For more information on the WARM methodology, see the FASB Staff Q&A TOPIC 326, NO. 1: Whether the Weighted Average Remaining Maturity Method is an Acceptable Method to Estimate Expected Credit Losses.
Close and return to topWhat type of credit unions should consider the Simplified CECL Tool?
The intended users of the CECL Tool are credit unions with under $100 million in assets, or those with similar characteristics as smaller credit unions. While there is no specific threshold for its use, the appropriateness of the tool’s usage by each credit union should be evaluated on a case-by-case basis, approved by management, and consulted on with the credit union’s auditor. Figures 8 and 9, in the Appendix, contain summary statistics on the loan data used to estimate each portfolio segment’s WARM factor. Credit unions should compare these values to their own loan portfolios to determine the applicability of the WARM factors. The CECL Tool allows qualitative adjustments to the WARM factors for credit unions to calibrate it to their loan portfolio segments.
Close and return to topThe Model Structure: What methodology does the tool use to estimate ACL?
The CECL Tool uses the WARM method under the expected loss rate approach to estimate the ACL. The estimated ACL is comprised of estimates for pooled loans and individually evaluated loans separately, segmented based on loan portfolio segments that mirror the segments in NCUA’s Call Report. The combined ACL from the pooled and individually evaluated loans is divided by the current outstanding balance to derive the ACL ratio.
For pooled loans, the ACL is estimated using three inputs:
- The current loan balance as of the measurement date;
- An estimated annual NCO rate; and
- An estimated WARM factor.
User-defined adjustments can be made within the CECL Tool to the NCO and WARM factors to account for qualitative factors and risks or unique circumstances not captured in these inputs. See below for a summary of each input. A description of the Q-factors is presented in a later section.
- Current loan balance: This input needs to be updated by the credit union utilizing the CECL Tool at each measurement date (for example, June 30, 2022). These loan balances should agree to the current quarter Call Report.
- NCO rate: The CECL Tool estimates the annualized NCO rate for each loan segment as the simple average NCO rate over the preceding three years. To determine the average, the rates from the previous three calendar years are weighted by the average balance of the loan portfolio category for the year (calculated as the average of the beginning and ending balances). Once the NCO rates for each year are calculated, they are averaged to arrive at the selected NCO rate. NCO and loan balance data from historical Call Reports are pre-populated in the CECL Tool to estimate the NCO rates.3
- WARM factors: The CECL Tool is pre-populated with WARM factors estimated by a third party using performance data obtained from a peer set of credit unions as well as prepayment rate estimates. The WARM factors are presented at a segment level, though they are estimated at a loan level and aggregated outside of the CECL Tool. The WARM factors represent the remaining term to contractual maturity, adjusted for scheduled amortization and prepayments. The scheduled amortization is calculated based on individual loan’s contractual maturity date and its amortization type (principal and interest, interest only). Prepayment rates are estimated using prepayment studies performed for credit unions in the peer set as well as market-based prepayment data.
For individually evaluated loans, the ACL is estimated using inputs sourced from the credit union regarding current loan balance and the amount expected to be collected on a loan level basis, organized by segment. The ACL is estimated as the deficit, if any, between the expected amount to be collected and the current loan balance.
Close and return to topAdvantages and Considerations: Why does the Simplified CECL Tool use an expected loss rate model to estimate ACL?
The CECL Tool uses the WARM method to estimate the ACL for the following reasons:
- The fundamental advantage of the WARM method is its simplicity compared to other methods. The WARM method only requires historical NCO data at an aggregated level of segmentation as opposed to a probability of default and loss given default approach, or the use of more statistical modeling approaches that also require loan-level data. Nearly all data, calculations, and outputs are contained within a single Microsoft Excel workbook. These factors streamline the process, reducing the risk of user error and making the workbook more user-friendly. The use of the WARM method reduces a credit union’s need for in-house or contracted modeling expertise, making the approach particularly advantageous for smaller-sized credit unions.
- The WARM method is highly transparent. Validation is straightforward with simple Microsoft Excel formulas and a low number of data sources and calculations. In addition, the use of a consistent methodology across all loan segments increases simplicity and is highly scalable compared to other modeling approaches.
Despite these advantages, the model user must be mindful of the following key considerations associated with the use of the WARM method. In certain situations, these considerations will require a qualitative adjustment.
- The WARM method provides a lower level of precision than alternate model approaches. Because the NCO rate is estimated from historical charge-off activity at an aggregated level of segmentation, this method has a lower sensitivity to changes in the underlying drivers of charge-off activity, such as changes in delinquency, credit scores, collateral values, or other leading indicators.
Example: A credit union experiences an uptick in its delinquency rate as of the measurement date. Loan #1 has missed two payments as of the measurement date, and the credit union has a positive delinquency rate. Because the loan is less than the threshold at which a charge-off event occurs (presumed to be 120 days delinquent), the segment NCO rate remains at zero (assuming no other charge-offs in the lookback period). Once Loan #1 reaches 120-days of delinquency, the credit union decides to charge off a portion of the balance. Because the Tool uses historical charge-off activity to estimate the annual NCO rate, this credit union’s NCO rate estimate will not capture the expected loss event, even though the loan is in delinquency status as of the measurement date. The credit union may need to use an adjustment factor to account for the uptick in delinquency that has not yet translated to charge-off activity.Figure 1: Example of WARM Methodology Using Historical NCO Data
Item Day 0 Day 30 Day 60 Day 90 Day 120 Total Portfolio Balance $1,000 $1,000 $1,000 $1,000 $995 Loan #1 Status Current 30 DPD 60 DPD 90 DPD 120 DPD Loan #1 Balance $100 $100 $100 $100 $95 Loan #1 NCO $ $0 $0 $0 $0 $5 Delinquency % 0.00% 10.00% 10.00% 10.00% 9.50% NCO % 0.00% 0.00% 0.00% 0.00% 0.50% - The model is backward-looking. The use of historical NCO activity to estimate future NCO rates assumes future loan performance will resemble the historical loan performance over the lookback period. If this is not the expectation of the credit union as of the measurement date, a qualitative adjustment must be considered.
- The model uses a uniform methodology for all loan segments. While this provides the benefit of simplicity, this approach may not fully capture the size, growth, complexity, or uniqueness of each product.
Why does the tool reduce the thirteen loan portfolio segments to ten?
The CECL Tool is structured to parallel the loan portfolio categories listed in NCUA’s Call Report (Schedule A, Section 1, Loans and Leases, lines 1 through 13). Prior to the March 2022 Call Report update, some historical charge-off rates were not grouped with the current set of real estate loan portfolio categories. Therefore, some loan categories are grouped according to the old Call Report categories to apply the relevant charge-off rates. Appendix B lists and explains the loan portfolio categories.
The following segments are grouped as “Real Estate Secured Consumer Loans”:
- Secured by first lien on a single 1- to 4-family residential property
- Secured by junior lien on a single 1- to 4-family residential property
- All other (non-commercial) real estate loans/lines of credit
The following segments are grouped as “All Other Loans”:
- All other unsecured loans/lines of credit
- All other secured non-real estate loans/lines of credit
Does the tool calculate the ACL for all assets subject to CECL?
No. The CECL Tool calculated the ACL for loan portfolio categories listed in NCUA’s Call Report (Schedule A, Section 1, Loans and Leases, lines 1 through 13). The CECL Tool does not address other assets that are subject to CECL, like trade receivables and held-to-maturity debt securities. Credits unions will need to select and apply a credit loss model under CECL that is appropriate for the size and complexity of these assets.
Close and return to topWho do I contact with questions on the Simplified CECL Tool?
Please contact the Chief Accountant within the Office of Examination and Insurance at eimail@ncua.gov or 703.518.6360.
Close and return to topData
Data Requirements: What are the data requirements to use the Tool?
Data requirements to use the CECL Tool are minimal, with most required data inputs contained within the tool itself. The relevant historical Call Report data used to estimate the average NCO data is pre-populated within the CECL Tool. This data is updated on a quarterly basis, so it is critical that each user pull the latest version of the tool from the NCUA website when it is available.
The CECL Tool does require external data. The specific external data required for input into the tool are listed below.
- Outstanding loan balances as of the measurement date for each loan portfolio segment. Credit unions will need to input outstanding loan balances aggregated by Call Report code. These balances must be split by pooled and individually evaluated loans.
- Outstanding loan balances and the expected amount to be collected on individually evaluated loans.
- Data for Q-factors. While only the Q-factors are required to be input into the CECL Tool, credit unions should compile the additional data used to quantify and support the Q-factors applied at the segment level to the NCO rates and WARM factors. Justifications for each qualitative adjustment must be documented.
Data Adjustments: What actions should a credit union take if it does not feel that the past three years are representative of the future (minimal charge-offs, new products, etc.)?
Q-factors can be formulated to address a credit union’s view of the future which they do not feel is currently reflected in its ACL. In other words, the Q-factors are used to convert historically based NCO rate and WARM factors into values that represent forecasted economic conditions and unique circumstances surrounding a given credit union’s loan portfolio. Please see Section Five – Qualitative Adjustments for greater detail on the adjustment process.
Close and return to topAssumptions
Net Charge-off Rate: Three-Year Lookback Window—Why does the tool use a three-year lookback window to calculate its net charge-off rate estimate?
The CECL Tool uses historical NCO activity from the past three years to estimate the annual NCO rate. A three-year lookback window was selected for the following reasons:
- A three-year lookback window allows for the annual NCO rate to be more responsive to recent trends in loan performance and economic conditions.
- The three-year lookback window mitigates potential data issues that may be present when using longer time periods for modeling purposes. For instance, Call Report segmentation changes periodically, which may cause misalignment in the segmentation and require more manual adjustments. In addition, in instances where there is historical merger and acquisition activity, the periods before the transaction will not include the target’s financial performance. While the impact of mergers and acquisitions may be present in the three-year lookback window, the likelihood is lower than when using a longer lookback period. This may lead to a misalignment when using the historical data to project future performance.
Despite these advantages, the model user must be mindful of the following key considerations associated with the use of a three-year lookback window. In certain situations, these considerations may require a qualitative adjustment.
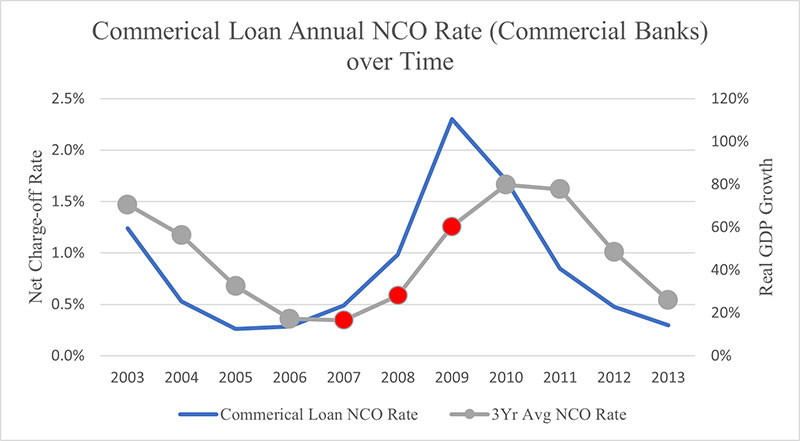
- A shorter lookback window can introduce recency bias into the NCO rate estimate if the lookback window is not representative of future economic conditions. Because a three-year lookback window likely does not encompass a full economic cycle, the tool’s NCO rate estimate may be biased, depending on the difference between that historical economic period and the forecasted economic conditions.
Example: Figure 2 charts the commercial loan NCO rate at all commercial banks and a three-year average over time. During the economic recession of the late 2000s, commercial NCO rates rose. As the annual commercial loan NCO rate rose between 2007 and 2009, the three-year average over the same period lags the actual rate. In certain situations, the use of a lookback window to estimate future losses may not encapsulate all the risks to future loan performance. In these situations, a qualitative adjustment to the NCO rate may be required.
- A short lookback window could lead to the NCO rate estimate being overly sensitive to unique historical circumstances with large impacts on loan performance data. If the likelihood is low that these events may reoccur in the forecast period, the NCO rate will be biased.
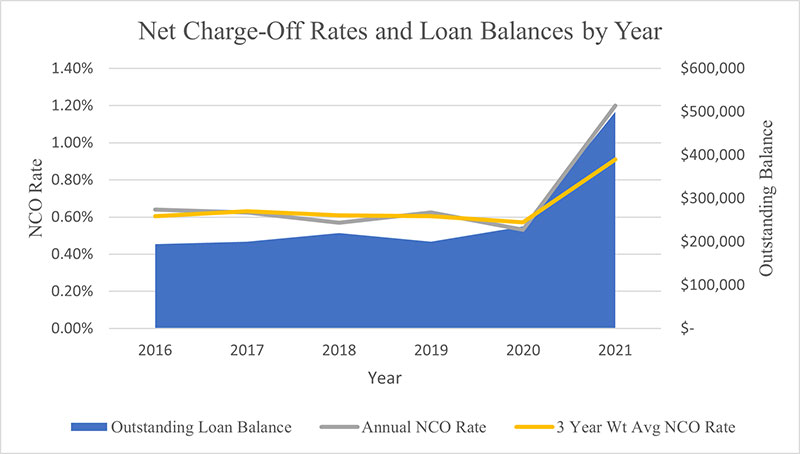
Example: Assuming a measurement date of March 31, 2023, much of the three-year lookback window will encompass COVID-19 pandemic-related performance. This period includes government intervention in the form of mandated lockdowns, fiscal and monetary stimulus, loan forbearance, foreclosure moratoriums, and a variety of other government action. This has impacted loan performance in a manner that may not be consistent with future economic conditions and loan performance. With this assumption and without adjustment, the NCO estimate may not produce a reliable forecast of future NCO rates. - Another potential risk of a three-year lookback window is the potential for it to produce an NCO rate estimate that is volatile period over period. By using only three calendar years of historical data, a large portion of the historical data used to calculate the NCO rate will be replaced when rolling the three-year lookback forward. This may lead to changes in the NCO rate that are not consistent with recent changes in economic conditions or loan performance.
Example: Until the most recent calendar year, a credit union’s outstanding loan balances and NCOs in a portfolio segment have remained nearly static. In the past year, however, the credit union had a large increase in new loans and experienced a sharp rise in charge-off activity. Under these conditions, the three-year average NCO rate increases dramatically. This circumstance highlights the potential for volatility in the NCO rate estimate given large swings in both historical NCO rates and historical loan balances. Depending on a credit union’s expected future charge-offs on new loans, a qualitative adjustment may be necessary.
- The lookback window may not be long enough to capture a period commensurate with the contractual life of each product. For products with an average life-of-loan greater than the lookback period, there is a risk that the average NCO rate will not entirely encompass the lifetime risk of the product. Because the risk of charge-off changes over the life of the product, a three-year lookback window could omit a certain portion of the loan’s life and its associated NCO activity over that period.
- Merger and acquisition activity among credit unions can cause discontinuity in NCO estimates. When a transaction closes, the Call Report will subsequently capture the loan performance of the blended credit union. However, the financial statements before the transaction close date will not include this blending, resulting in a potential inconsistency in historical NCO rates.
Example: Credit Union X acquired Credit Union Y three quarters ago, both with equal balances in each loan segment. Since that point, their financial information has been aggregated in the past three quarterly Call Reports. Before that, Credit Union X’s Call Report only reflects its pre-transaction NCO rate (0.2 percent). Based on the example below, the calculated NCO rate of the combined credit union would be 0.3 percent when using only the acquirer’s Call Report data. However, if the historical data for both credit unions were considered for the entirety of the three-year lookback window, the calculated NCO rate would be 0.6 percent. Given these circumstances, a loss rate adjustment may be required.
| NCO Rates | 1 | 2 | 3 | 4 | 5 | 6 | 7 | 8 | 9 | 10 | 11 | 12 |
|---|---|---|---|---|---|---|---|---|---|---|---|---|
| Quarterly NCO Rate—Target Only | 1.0% | 1.0% | 1.0% | 1.0% | 1.0% | 1.0% | 1.0% | 1.0% | 1.0% | 1.0% | 1.0% | 1.0% |
| Quarterly NCO Rate—Acquirer Only | 0.2% | 0.2% | 0.2% | 0.2% | 0.2% | 0.2% | 0.2% | 0.2% | 0.2% | 0.2% | 0.2% | 0.2% |
| Quarterly NCO Rate—Acquirer Call Report | 0.6% | 0.6% | 0.6% | 0.2% | 0.2% | 0.2% | 0.2% | 0.2% | 0.2% | 0.2% | 0.2% | 0.2% |
Loan Segmentation: Call Report Code (Loan Type)—Why does the tool segment loan portfolios by Call Report code?
The CECL Tool uses the 13 loan portfolio segments from Schedule A, Section 1 Loans and Leases, on page 6 of the Call Report. Each loan portfolio line is referred to as a “Call Report Code.” For example, New Vehicle Loans is Call Report Code 385. Each Call Report Code is used as the segmentation for estimating the ACL. This segmentation is used for the following reasons:
- Segmenting loan portfolios by loan type (specifically Call Report codes) allows the CECL Tool to leverage readily available quarterly Call Reports as input data. This information is available for all credit unions and in a format that is standardized and reliable. Because Call Report data is generally formatted consistently across time and credit union (aside from changes to Call Report guidelines), there is much less need for specialized data cleaning and manipulation procedures. Call Report data is considered reliable because it is vetted internally by credit unions and reviewed by examiners and auditors frequently; this substantially lowers the risk of inaccurate data affecting ACL estimates.
- Using a single stratum to segment loan portfolios minimizes the risk of over segmenting the data, and thus producing volatile estimates. Given many of the potential users of this tool are credit unions with relatively small loan portfolios, the use of multiple criteria for pooling loans creates loan segments with a small amount of historical data. With a limited sample of loans, the potential for estimates to be overly influenced by changes in small numbers of loans is high. Use of fewer loan segments mitigates the risks of over segmentation.
The model user must be mindful of the following key considerations associated with segmenting ACL estimation by loan type. In certain situations, these considerations may necessitate a qualitative adjustment.
- Pooling loans by a single loan characteristic, like loan type, provides less granularity in estimating NCO rates than when segmenting by multiple loan characteristics. It is therefore more difficult to pinpoint the exact drivers of loss in the face of shifting NCO rate estimates, especially because loan performance tends to be driven by a variety of factors.
Example: The two scenarios in Figure 5 compare the average NCO rates for single family residential loans given differing compositions of loan-to-value (LTV) ratios in the loan pool. In both scenarios, a credit union holds $1 million in mortgage assets and has a constant NCO rate within each LTV category. In scenario A, the average NCO rate would be 0.55 percent. In Scenario B, the average NCO rate would increase to 0.78 percent as a function of the change in the LTV composition.
Figure 5
Session Loan to Value Category Outstanding Loan Balance Net Charge-offs Average Net Charge-off Rate Session A < 80% $500,000 $1,500 0.30% Session A 80% - 90% $250,000 $1,000 0.40% Session A > 90% $250,000 $3,000 1.20% Session A Total $1,000,000 $5,500 0.55% Session B < 80% $250,000 $750 0.30% Session B 80% - 90% $250,000 $1,000 0.40% Session B > 90% $500,000 $6,000 1.20% Session B Total $1,000,000 $7,750 0.78% - If a credit union changes the underlying product composition or introduces a new product within a given segment, the historical data for that segment may not be representative of future loan performance.
Example: The two scenarios in Figure 6 compare the average NCO rates for single family residential loans given differing compositions of the products in the segment. In both scenarios, a credit union holds $1 million in mortgage assets. The pool is comprised of two types of assets, 15-year mortgages and 30-year mortgages, which each have a constant NCO rate of 0.4 percent and 0.8 percent, respectively, in each scenario. In scenario A, the segment has an average NCO rate of 0.5 percent. In Scenario B, the segment has an average NCO rate of 0.7 percent, as a function of the change in the product composition.
Figure 6
Scenario Mortgage Type Outstanding Loan Balance Net Charge-offs Average Net Charge-off Rate Scenario A 15-Year Mortgages $750,000 $3,000 0.40% Scenario A 30-Year Mortgages $250,000 $2,000 0.80% Scenario A Total $1,000,000 $5,000 0.50% Scenario B 15-Year Mortgages $250,000 $1,000 0.40% Scenario B 30-Year Mortgages $750,000 $6,000 0.80% Scenario B Total $1,000,000 $7,000 0.70% - Pooling at the Call Report code level affixes the segmentation. Because the definitions of loan type are provided by the Call Report, individual credit unions are not able to further breakout loan pools to adjust for specialty or unique products. Credit unions are unable to estimate NCO rates for subsections of Call Report codes or make Q-factors for those subsections.
- Credit unions have less flexibility to make specific data adjustments for outliers or discontinued portfolios. A fixed pooling system limits a credit union’s ability to make sub-pool level adjustments to compensate for extraneous data.
Remaining Life: WARM Factors
WARM factors are used by the CECL Tool as a proxy for the weighted average remaining life of each segment.
The CECL Tool is pre-populated with WARM factors estimated by a third party using loan level performance data obtained from a peer set of credit unions as well as market-based prepayment data. The WARM factors represent the remaining term to contractual maturity, adjusted for scheduled amortization and prepayments. The scheduled amortization is calculated based on the individual loan’s contractual maturity date and its amortization type (principal and interest, interest only). Prepayment rates are estimated using prepayment studies performed for credit unions in the peer set as well as market-based prepayment data. WARM factors are estimated at the loan level, aggregated at the segment level, and then input into the CECL Tool. The Appendix contains more detailed data on the factors.
The CECL Tool utilizes WARM factors for the following reasons:
- WARM factors provide a simple proxy for the life-of-loan estimates required by the CECL guidance and are supported by industry research. By using industry-based WARM factors, individual credit unions do not need to undergo the burdensome process of estimating loan duration, which requires specialized analytical skills and dynamic cash flow models. The process of formulating credit union-specific WARM factors also requires acquiring, transforming, and manipulating large data sets of both internal and external loan performance history as well as market data on a frequent basis.
- The WARM factors are generated using both credit union peer data set and recent market data, making them particularly reflective of current conditions for credit unions. The use of large peer data sets mitigates the risks of “thin” data when developing WARM factors at the credit union level.
Despite the advantages, the model user must be mindful of the following key considerations associated with the use of WARM factors in ACL estimation. In certain situations, these considerations may necessitate a qualitative adjustment.
The WARM factors used by the CECL Tool are not credit union specific. Therefore, individual credit unions may have historical prepayment rates or contractual terms that differ from industry averages.
Close and return to topQualitative Adjustments
Does the WARM Method Require Qualitative Adjustments?
Under the WARM methodology, a starting point for determining the ACL is the historical NCO rates. The CECL accounting standard recognizes that:
“…historical credit loss experience of financial assets with similar risk characteristics generally provides a basis for an entity’s assessment of expected credit losses.” (ASC 326-20-30-8)
However, this basis must be adjusted.
“An entity shall not rely solely on past events to estimate expected credit losses. When an entity uses historical loss information, it shall consider the need to adjust historical information to reflect the extent to which management expects current conditions and reasonable and supportable forecasts to differ from the conditions that existed for the period over which historical information was evaluated.” (ASC 326-20-30-9)
Within the CECL Tool, qualitative adjustments calibrate both the NCO rates and the WARM factors. The qualitative adjustments work as an addition to or subtraction from the original value. For example, if an economic recession is expected, the historical NCO rate is increased to include expected losses that are not included in the original charge off rate. The original NCO rate may not cover a period of an entire business cycle, which includes a recession. Also, if higher than historical inflation continues, the WARM factor is increased to adjust for the slowing of prepayments. Due to higher inflation and increased borrowing rates, debtors will likely slow down refinancing or paying off their loans early.
Close and return to topAdjustments for Qualitative Factors (Q-factors): When is a Q‑factor necessary?
The CECL Tool provides credit unions the ability to incorporate adjustments to their NCO rate estimate and the provided WARM factors. The purpose of the Q‑factors is to increase the relevance of the quantitative ACL within the tool to a credit union’s unique circumstances. While there are no prescribed criteria that trigger the need for qualitative adjustments, credit unions should compare the historical conditions under which the NCO rate was formulated to current as well as forecasted future conditions. In addition, credit unions should compare the contractual terms of their loans and recent prepayment activity to the provided WARM outputs to assess if any adjustment is necessary. Ultimately, the Q-factors are intended to capture missing or misrepresented risks in the loan segments.
Listed below are illustrative circumstances that may require the use of a Q-factor:
- Shifting trends in the nature or volume of financial assets.
Example: A credit union begins indirect lending and experiences 35 percent growth in auto lending in a six-month timeframe. Because the credit union’s historical NCO experience does not reflect the current composition of assets, the credit union will need to approximate the effect of both the impact of a new product and significant changes in the volume of auto lending on its future NCO rate. - Existence and effect of any concentrations of credit.
Example: A credit union has a 95 percent loan-to-share ratio with 80 percent of loans concentrated in real estate. The credit union may need to adjust the NCO rate or the WARM factor in the CECL Tool to mirror the credit risks default rate and loan life of this concentrated loan portfolio. - Volume and severity of past due financial assets.
Example: A credit union experienced a significant increase in past due loans in the last two months, with an expectation that many of these loans may incur a charge-off in the next three months. Because the current delinquency rate is not considered in the future NCO estimation and the historical NCOs do not yet reflect the higher delinquency levels, the credit union will need to incorporate the increased likelihood of future charge-off activity into its NCO rate. - Changes in the value of underlying collateral.
Example: Over the past several years, home values have risen dramatically. This increase in the price of the collateral on home loans is expected to result in lower loss severity for defaulted loans. This decrease in loss given default would translate to a lower NCO rate on home loans.
If the historical lookback window does not fully capture this decline in loss given default, a credit union may need to use a Q-factor to adjust the forecasted NCO rate. Consider this Q-factor if the loan is not collateral-dependent whereby credit union expects repayment to come from sale of collateral less cost to sell. - Changes in lending strategies – policies and procedures.
Example: A credit union loosens underwriting standards to provide more loans to riskier borrowers. Looser underwriting standards increase credit risk in the portfolio. The credit union will need to adjust its historical NCO rate to incorporate the impact of riskier loans on the future NCO rate. - Quality of credit review function.
Example: A quality control function reviews adherence to current lending policies. A third party auditor reviews a credit union’s adherence to current lending policies over the past year and finds systemic underestimation of risk. The credit union must appropriately adjust its future NCO rate to compensate for the heightened risk of loans added in the past year. - Experience, ability, and depth of lending staff.
Example: Three out of four of the credit union’s loan staff have more than 10 years of experience. A credit union experiences a high degree of turnover in its loan staff, leaving fewer senior employees. With less experience at the credit union, the chances of underestimating credit risk during the underwriting process increases. The endorsement of riskier loans could translate to higher NCOs in the future. The credit union may need to adjust for potential higher NCOs. - External factors — Competition, technology, natural disasters.
Example: A financial institution new to the credit union’s market offers similar products and services, leading to underpricing of risk due to the increased competition. The credit union should adjust for potential increased losses for underpricing loans.
Example: A wildfire causes extensive damage in the credit union’s service area, the first occurrence within the lookback period. The fire caused extensive damage to local businesses and homes and therefore increased the probability of default and potentially loss severity on several of its loans. The credit union should adjust for these factors. - Changes to the general market conditions of a local area.
Example: There is an increase in the local unemployment rate which is higher than the national increase. The local increase in the unemployment rate will negatively impact borrowers, increasing the odds of expected losses even though national economic indicators would not indicate as such. Given this, a credit union should adjust its future loss expectations with the use of a Q-factor. - Changes to local business conditions.
Example: The credit union primarily serves a select employee group and the sponsor recently declared bankruptcy. The credit union will need to adjust its historical NCO rate to incorporate the effect of the bankruptcy on default risk on the future NCO rate.
Q-factor Estimation: How should a credit union estimate the scale of the adjustment?
There is no prescribed guidance for estimating the value of a Q-factor. The magnitude and direction of the adjustment factor depends on the circumstances necessitating the adjustment. An adjustment grounded in discernable observations or data is preferable and provides stronger support when challenged. The following methods could be appropriate in certain circumstances:
- A credit union could derive a Q-factor by benchmarking its results to peer credit unions. To determine the appropriate degree of adjustment, a credit union can compare loss estimates with similar credit unions and calculate a scalar value if necessary.
Example: A credit union offers a new financial product to its members. Due to its novelty, the credit union does not have historical NCO history to estimate future losses. Without historical NCO information, the credit union needs a proxy to estimate the future losses. The credit union could estimate the future NCO rate by benchmarking to peer credit unions that have historical loss experience with this financial product. To do this, the credit union could select an NCO rate based on a review of the NCO rates of other credit unions for this product. - The use of sensitivity analyses to assess the impact of various inputs and assumptions to various economic and other scenarios.
For the WARM factor adjustments in particular, credit unions should assess if their segments have significantly different contractual terms or prepayment rates compared to the pre-populated WARM factors based on industry data. If there are significant differences, a WARM factor adjustment will be necessary.
Example: A credit union experienced an increase in 30-year first lien single family residential loans in the past three years, despite a national downward trend in loans. Due to this influx of new loans, the credit union’s Weighted Average Maturity (WAM) for its first lien single family residential loan portfolio segment is 300 months (before scheduled amortization and prepayments). In the CECL Tool, the WAM used as the starting point for the pre-populated WARM factor is 250 months. Given this difference between the credit union’s specific WAM and the industry based WAM, the pre-populated WARM factor may not be appropriate, and the credit union may be required to make an adjustment.
In this circumstance, the credit union could consider calculating the relative ratio of the pre-populated WAM for that loan segment to its specific WAM (for example, 300/250 = 1.2), then applying that ratio to the pre-populated WARM factor. The difference between the implied WARM factor and the pre-populated WARM factor would be the required adjustment.
| Item | Industry | Credit Union |
|---|---|---|
| Weighted Average Maturity (WAM) | 250 | 300 |
| Relative Ratio (WARM Adjustment) | N/A | 1.2 |
| WARM Factor | 130 | 156 |
Documentation
Model Governance Process and Controls: What are the key elements a credit union needs to monitor in perpetuity?
Even when using a simplified modeling approach, instituting basic model governance processes as a means of assessing the validity of the model output is necessary. Related to the CECL Tool, a credit union should document the new processes or modifications to existing processes performed for the ACL estimation (data, calculations, testing, outputs, reporting, approvals) as well as the internal control measures in place to ensure the output is accurate.
Credit unions that adopt the tool for estimating their ACL should institute a variety of model performance metrics, which can be monitored similarly to existing allowance modeling processes. These metrics should have acceptability thresholds and there should be processes in place to address any outliers. Inclusion of a parallel run process to better understand the drivers of differences between the existing allowance and the ACL is a leading practice. In addition, completion of a model validation of the ACL process, especially before adoption of the approach, is also a leading practice. All these processes and the testing results should be recorded in an official model governance document.
Close and return to topModel Documentation: Do credit unions need to document the key model decisions made when using the Simplified CECL Tool?
Yes, credit unions should prepare documentation supporting their key decisions for a variety of reasons, one of which is to demonstrate their compliance with the CECL guidance for ACL modeling. The credit union’s model documentation should encompass both the ACL calculation process, key decisions/assumptions (and supporting evidence), and subsequent output review measures. The documentation should include a section that focuses on any adjustments applied, including the nature of the adjustment, the quantification of the adjustment, and the rationale behind the adjustment. Any testing performed (back testing, benchmarking, sensitivity) should also be documented, as well as attribution analyses that highlight the impact of changes in underlying data, inputs, and assumptions.
Model documentation should be updated at every measurement date, with a focus on key changes from the prior version of the CECL Tool. A credit union may be required to share model documentation with auditors as part of the financial reporting process. The audit approach for CECL will generally involve analyzing a credit union’s ACL estimate, so clear documentation supporting all decisions and assumptions made and compliance with ASC 326-20 is critical.
Close and return to topUsing the Tool
My credit union updates its allowance accounts monthly. Can I use the Simplified CECL Tool monthly?
Yes. The Tool is updated each quarter, but a credit union can use the Tool for month-end reporting. With the implementation of CECL in 2023, the Tool can be updated with month-end loan portfolio segment values to determine the ACL on loans and leases. Qualitative adjustments should be updated to ensure appropriateness.
As an example, the December 2022 version of the Tool can be updated to estimate the ACL on loans and leases for January 2023 and February 2023. The March 2023 version of the Tool can be updated to estimate the ACL on loans and leases for March 2023, April 2023, and May 2023.
Close and return to topIs using the Tool a safe harbor?
No. Use of the Tool, in and of itself, does not create a safe harbor. The credit union’s management must adapt and refine the tool to its circumstances.
The CECL Tool and the underlying methodology may not be appropriate for every credit union. Each credit union's management determines whether this approach is appropriate given the unique circumstances of their institution. A credit union may use whichever method that produces an accurate estimate of the institution’s ACL. The selected method should be:
- Appropriate for the financial assets being evaluated;
- Consistent with the credit union's size and complexity; and
- Well documented, with clear explanations of supporting analyses and rationale.
The CECL accounting standard allows the use of judgment in determining the relevant information and estimation methods appropriate in the credit union’s circumstances, and the credit union's management is responsible for ensuring the ACL conforms with GAAP and adequately covers credit risk.
Close and return to topIf the Tool shows a negative weighted average three-year net charge-off rate, how should this be adjusted?
Using your credit union’s negative weighted average three-year net charge-off rate will likely understate the estimate of credit losses on the related loan segment.
Using Tab 4 – Adjustments, the negative weighted average three-year charge-off rate should be changed to management’s estimated loss rate, which includes consideration of current conditions and reasonable and supportable forecasts.
Close and return to topWhere do overdrafts fit into the Tool?
In the Tool, overdrafts are included in the loan portfolio category labeled All Other Loans.
In the Call Report Instructions, overdrafts should be included of All Other Unsecured/Lines of Credit (Call Report Account 397). In the Tool, All Other Unsecured/Lines of Credit is combined with All Other Secured Non-Real Estate Loans/Lines of Credit (Call Report Account 698C) to create the loan portfolio segment of All Other Loans. Within the Tool’s weighted average three-year net charge-off rate for All Other Loans, net charge-offs related to overdrafts will be included in the credit union’s loss rate.
Because of the March 2022 changes to the Call Report codes, which expanded segmentation, the CECL Tool combines several of the prior and new Call Report codes into a single loan portfolio segment to maintain continuity with historical Call Report line items. This is necessary to calculate historical average NCO rates when pre-March 2022 data is included in the calculation.
When reviewing the estimate for ACL for All Other Loans (Tab 3, cell Q15), assess whether:
- The weighted average three-year net charge-off rate contains net charge-offs for overdrafts; and
- The industry weighted average remaining maturity (WARM) factor parallels the credit union’s loan portfolio make-up.
In assessing the WARM factor, Tab 5 – WARM Data provides current balances for All Other Unsecured Loans/Lines of Credit and All Other Secured Non-Real-estate Loans /Lines of Credit. From these values, a credit union can determine if the weighted value (from this ratio) is similar to its portfolio weighting. An adjustment can be made to the WARM factor in Tab 4 – Adjustments, to align the WARM factor to the credit union’s loan portfolio make-up.
While qualitative adjustments may be needed for the above scenarios, qualitative adjustments should also include current conditions and reasonable and supportable forecasts.
Close and return to topWhat loans should be evaluated individually (listed in Tab 2 – Individual Basis)?
Loans that do not share the same risk characteristics as the pooled loans should be evaluated individually. As an example, delinquent loans are usually evaluated individually because the risk of charge-off is much higher than performing loans.
Close and return to topI am not seeing my current year losses in the three-year average net charge-off rate?
The Tool uses loss rates from the fourth quarter, starting with the prior year. Loss rates are updated for each March release; thus, current year losses are not included in the Tool.
The net charge offs from 2022 are not included in the three-year average net charge-off rate in the Tool’s templates for June 2022, September 2022, and December 2022. Because charge-offs are seasonal, the most accurate charge-off rates come from the fourth quarter Call Report. For the update of the Tool’s template for March 2023, net charge-offs for 2022 (quarter four) will be included in the three-year average net charge-off rate.
Close and return to topThe three-year average net charge-off rates are understated because the current year losses are not yet included. What should be done?
Under the CECL accounting standard, expected credit losses should include the best estimate for current conditions and reasonable and supportable forecasts (ASC 325-20-30). An increase in current charge-offs above the historical trend should be considered in developing the best estimate. Because the Tool has a lag in updating the three-year average net charge-off rates, use qualitative adjustments to incorporate this recent trend, as well as the reasonable effect over the contractual term of pooled loans.
Close and return to topHow should participation loans be handled in the Tool?
Report participation loans in their respective loan category in the Call Report Schedule A, Section 1 – Loans and Leases. This allows the Call Report process to gather data on net charge-offs, which is used to calculate the Tool’s weighted average three-year net charge-off rates.
For credit unions that have a history of purchasing participation loans, the Tool’s related weighted average three year net charge-off rates will contain the relevant historical charge-off data. Thus, participation loan data can be included in the Tool like other loans. A credit union should assess whether qualitative adjustments (in Tab 4) are needed to calibrate the loss rate and WARM factor, such as due to recent changes in the mix of participation loans to other loans in a portfolio segment.
For credit unions that are new to participation loans, the Tool’s related weighted average three year net charge-off rates will not contain the relevant charge-off data. A credit union should make qualitative adjustments (in Tab 4) to factor in estimated loss rates related to participation loans.
Participation loans may contain risks that are not similar to the risk characteristics of loans in a portfolio segment. Loans that do not share similar risk characteristics may need to be individually evaluated by using Tab 2 – Individual Basis. Also consider if the ACL on participation loans should be estimated using another credit loss methodology, such as discounted cash flows or probability of default/loss given default; in this case, estimated credit losses on participation loans would be calculated outside of the Tool.
While qualitative adjustments may be needed for the above scenarios, qualitative adjustments should also include current conditions and reasonable and supportable forecasts.
Close and return to topHow should indirect loan programs be handled in the Tool?
Indirect loans should be reported in their respective loan category in the Call Report Schedule A, Section 1 – Loans and Leases. This allows the Call Report process to gather data on net charge-offs, which is used to calculate the Tool’s weighted average three-year net charge-off rates.
For credit unions that have a history of making indirect loans, the Tool’s related weighted average three year net charge-off rates will contain the relevant historical charge-off data. Thus, indirect loan data can be included in the Tool like other loans. A credit union should assess whether qualitative adjustments (in Tab 4) are needed to calibrate the loss rate and WARM factor, for example, when there are recent changes in the mix of indirect loans to other loans in a portfolio segment.
Additionally, Tab 5 – WARM Data provides subsegment information on indirect loans for new and used autos. The related WARM factor may need to be adjusted, via Tab 4, if the proportion of indirect loans to total loans is significantly different from the peer ratio.
For credit unions that are new to indirect loans, the Tool’s related weighted average three year net charge-off rates will not contain the relevant charge-off data. A credit union should make qualitative adjustments (in Tab 4) to factor in estimated loss rates related to indirect loans.
Indirect loans may pose risks that are not similar to the risk characteristics of loans in a portfolio segment. Loans that do not share similar risk characteristics may need to be individually evaluated by using Tab 2 – Individual Basis.
While qualitative adjustments may be needed for the above scenarios, qualitative adjustments should also include current conditions and reasonable and supportable forecasts.
Close and return to topLarger Credit Unions
My credit union is larger than $100 million in assets. Can I use the Simplified CECL Tool?
While the Simplified CECL Tool is designed for credit unions under $100 million in assets, larger credit unions can use the Tool.
The Tool uses the WARM method for calculating the ACL on loans and leases. This method was chosen by the NCUA because the Financial Accounting Standards Board deemed it appropriate to estimate a credit loss allowance for less complex financial asset pools. (FASB Staff Q&A: TOPIC 326, NO. 1: Whether the Weighted-Average Remaining Maturity Method is an Acceptable Method to Estimate Expected Credit Losses)
For instance, WARM factors are derived from loan level data from credit unions that have assets of less than $100 million. A larger credit union runs a risk that its loan portfolio segments may not be similar to the credit unions used for deriving the Tool’s WARM factors.
For all credit unions, especially credit unions with assets in excess of $100 million, we recommend the following steps when considering whether to use the Tool for ACL estimation purposes:
- Assess whether the segmentation (pooling) of loans in the credit union’s existing ALLL model is appropriate and aligns with the thirteen loan portfolio segments listed in Call Report Schedule A, Section 1- Loans and Leases. This includes determining whether each segmentation pool contain similar risk characteristics. CECL requires that the risk characteristics are similar for the loans within each of the thirteen loan portfolio segments.
- Evaluate whether the credit union currently utilizes more complex modeling methodologies for its ALLL or for other significant activities with internal management, planning or financial reporting. Examples include, but are not limited to:
- More complex credit loss modeling (probability of default/loss given default, transition matrices or roll rates, etc.);
- Prepayment modeling;
- Interest rate risk modeling via an asset/liability management software;
- Capital stress testing; and
- Operational risk/fraud analytics.
Given its importance to the financial statements, model the ACL using methodologies similar in complexity to these other significant activities. The CECL accounting standard advocates that the ACL modeling should parallel the way in which the credit union measures, monitors, and manages its credit risk.
- Determine if the credit union has a dedicated ALLL/credit modeling team (especially staff with a statistical analysis background) or an established model risk management group. If the credit union has these resources and skillsets, it may need a more complex methodology to estimate its ACL.
- Assess whether the WARM factors (life-of-loan factors) are appropriate for each loan portfolio segment. Tab 5 – WARM Data provides sub-segments on auto and real estate loans. The related WARM factor is a weighted average of the sub-segments. The Tool’s default WARM factor may need to be adjusted to match the makeup of your credit union’s portfolio. The Tab also contains the WAM for the segments—to the extent WAM can be calculated for your loan segments, assess the comparability. WAM is the contractual term to maturity before prepayments.
Qualitative adjustments are used to refine the Tool to a credit union’s circumstances. See the Qualitative Adjustments section of the Simplified CECL Tool Frequently Asked Questions.
Close and return to topI am a larger credit union and some of my loan segments are less complex financial asset pools. Can I use the Tool to determine the ACL on these loan segments?
Yes. The Tool can be used to estimate the ACL on loan portfolio segments where the WARM methodology is applicable. Documentation should include the justification for using the Tool to determine the ACL on each chosen loan portfolio segment as well as the process for adding Tool’s results to other ACL models for estimating the credit union’s overall allowance for credit losses on loans and leases. Policies should implement and document quality control activities.
Close and return to topAppendix
Figures 8 and 9 contain summary statistics on the loan data used to estimate each portfolio segment’s WARM factor. Figure 8 displays relevant metrics for the WARM factor estimation at the portfolio segment level. Figure 9 presents the same information as Figure 8, but it breaks down portfolio segments into their product level components.
The fields in the tables are described below:
- Category: The type of loans grouped together to calculate the WARM factor. Figure 8 contains the portfolio segments used in the CECL Tool. Figure 9 breaks the portfolio segments into their financial product components (where possible).
- Call Field: The type of loan’s associated call field on the Call Report.
- Loan Count: The number of loans in the category.
- Avg Loan Rate: The average interest rate on the loans in the category.
- Wtd Avg Maturity: The average remaining term, weighted by loan balance.
- WARM: The average WARM factor in the pool of loans.
- Prepay Speed: The average annual prepayment assumption applied in the loan pool.
By comparing credit union-specific metrics to the industry-level metrics in the WARM factor tables below, a credit union can gain insight into the differences between its loans in its portfolio segments and those loans used to estimate the WARM factors. Differences in interest rate, remaining maturity, and prepayment expectations can all provide justification for credit union-specific adjustments to the WARM factors.
Figure 8: June 30, 2022, CECL Factors
| Item | Category | Call Field | Current Balance | Loan Count | Avg Loan Rate | Wtd Avg Maturity | WARM | Prepay Speed |
|---|---|---|---|---|---|---|---|---|
| 3 | Non-Federally Guaranteed Student Loans | 698A | 8,606,553 | 2,400 | 4.98 | 98.71 | 41.39 | 11.8% |
| 4 | All Other Unsecured Loans/Lines of Credit | 397 | 147,670,273 | 62,213 | 10.30 | 40.90 | 18.38 | 12.0% |
| 5 | New Vehicle Loans | 385 | 379,725,875 | 27,298 | 3.89 | 54.99 | 20.97 | 18.9% |
| 6 | Used Vehicle Loans | 370 | 1,000,050,914 | 94,421 | 4.83 | 52.72 | 18.93 | 23.9% |
| 8 | All Other Secured Non-Real-estate Loans /Lines of Credit | 698C | 49,830,850 | 3,223 | 6.06 | 85.02 | 29.08 | 17.4% |
| 9 | Loans/Lines of Credit Secured by a First Lien on a single 1-4 Family Res. | 703A | 1,283,145,405 | 11,338 | 3.71 | 217.28 | 65.61 | 11.1% |
| 10 | Loans/Lines of Credit Secured by a Junior Lien on a single 1-4 Family Res. | 386A | 155,578,396 | 9,125 | 5.37 | 155.12 | 52.90 | 11.7% |
| 11 | All Other Real Estate Loans/Lines of Credit | 386B | 15,083,004 | 579 | 3.97 | 110.80 | 75.06 | 8.0% |
| 12 | Commercial Loans/Lines of Credit Real Estate Secured | 718A5 | 64,231,821 | 412 | 4.38 | 94.47 | 34.80 | 9.4% |
| 13 | Commercial Loans/Lines of Credit Not Real-estate Secured | 400P | 45,577,345 | 584 | 4.11 | 108.38 | 39.21 | 10.6% |
Figure 9: June 30, 2022, CECL Factors, Product Level
| Item | Category | Call Field | Current Balance | Loan Count | Avg Loan Rate | Wtd Avg Maturity | WARM | Prepay Speed |
|---|---|---|---|---|---|---|---|---|
| 3 | Non-Federally Guaranteed Student Loans | 698A | 8,606,553 | 2,400 | 4.98 | 98.71 | 41.39 | 11.8% |
| Unsecured Loans | 397 | 128,924,034 | 54,116 | 10.02 | 41.92 | 18.63 | 12.6% | |
| Line of Credit | 397 | 18,746,239 | 8,097 | 12.25 | 33.88 | 16.62 | 7.8% | |
| 4 | All Other Unsecured Loans/Lines of Credit | 397 | 147,670,273 | 62,213 | 10.30 | 40.90 | 18.38 | 12.0% |
| New Auto | 385 | 227,477,733 | 17,413 | 3.84 | 55.48 | 20.81 | 19.8% | |
| Indirect New Auto | 385 | 152,248,142 | 9,885 | 3.97 | 54.27 | 21.20 | 17.5% | |
| 5 | New Vehicle Loans | 385 | 379,725,875 | 27,298 | 3.89 | 54.99 | 20.97 | 18.9% |
| Used Auto | 370 | 671,881,795 | 67,209 | 4.91 | 51.08 | 18.18 | 25.2% | |
| Indirect Used Auto | 370 | 328,169,120 | 27,212 | 4.67 | 56.08 | 20.46 | 21.3% | |
| 6 | Used Vehicle Loans | 370 | 1,000,050,914 | 94,421 | 4.83 | 52.72 | 18.93 | 23.9% |
| 8 | All Other Secured Non-Real-estate Loans /Lines of Credit | 698C | 49,830,850 | 3,223 | 6.06 | 85.02 | 29.08 | 17.4% |
| Mortgage up to 15 Years. | 703A | 498,509,302 | 5,639 | 3.47 | 130.17 | 45.31 | 11.8% | |
| Mortgage Over 15 Years | 703A | 625,568,721 | 4,360 | 3.80 | 289.84 | 83.49 | 9.9% | |
| Mortgage Balloon | 703A | 65,066,733 | 635 | 4.54 | 100.64 | 28.29 | 19.6% | |
| Mortgage ARM | 703A | 94,000,650 | 704 | 3.88 | 277.14 | 80.13 | 9.1% | |
| 9 | Loans/Lines of Credit Secured by a First Lien on a single 1-4 Family Res. | 703A | 1,283,145,405 | 11,338 | 3.71 | 217.28 | 65.61 | 11.1% |
| 10 | Loans/Lines of Credit Secured by a Junior Lien on a single 1-4 Family Res. | 386A | 155,578,396 | 9,125 | 5.37 | 155.12 | 52.90 | 11.7% |
| 11 | All Other Real Estate Loans/Lines of Credit | 386B | 15,083,004 | 579 | 3.97 | 110.80 | 75.06 | 8.0% |
| 12 | Commercial Loans/Lines of Credit Real Estate Secured | 718A5 | 64,231,821 | 412 | 4.38 | 94.47 | 34.80 | 9.4% |
| 13 | Commercial Loans/Lines of Credit Not Real-estate Secured | 400P | 45,577,345 | 584 | 4.11 | 108.38 | 39.21 | 10.6% |
Disclaimer
Utilizing the CECL Tool approach does not by itself ensure compliance with U.S. Generally Accepted Accounting Principles (GAAP) or any other requirement. While ASC 326 (Financial Instruments—Credit Losses) allows entities to use judgment in determining appropriate and relevant information and estimation methods, a credit union’s management is responsible for ensuring the ACL conforms with GAAP and adequately covers credit risk.
The CECL Tool is provided for information and convenience only. This document and the Simplified Tool do not constitute legal or accounting advice. Credit unions should consult their accounting advisors on whether the CECL Tool is appropriate for use (including qualitative adjustments made within) to determine the ACL on loans and leases for compliance with CECL, given facts and circumstances unique to them. The NCUA is providing the CECL Tool “as is” and the agency expressly disclaims all warranties, express or implied, including any implied warranties of merchantability and fitness for a particular purpose. The NCUA is not liable to credit unions or any third party for any direct, indirect, incidental, consequential, special, or exemplary damages or lost profit related to the use of the CECL Tool.
Footnotes
1 The peer data used for calculating Weighted Average Remaining Maturity factors is from credit unions under $100 million in assets; this peer data may not be relevant for credit unions with a larger asset size.
2 FASB Staff Q&A: TOPIC 326, NO. 1: Whether the Weighted-Average Remaining Maturity Method is an Acceptable Method to Estimate Expected Credit Losses
3 Credit unions provide NCO data via the Call Report process, which is used to calculate the balance-weighted average NCO rates.