
Introduction
The Federal Housing Finance Agency (FHFA) has been taking some initial steps in recent years for Fannie Mae and Freddie Mac—the enterprises—to issue mortgage-backed securities (MBS) that explicitly have socially desirable traits, in line with the general spirit of Environmental, Social, and Governance (ESG) investing. Both Fannie Mae and Freddie Mac already have relevant statutory commitments aimed at making housing credit available to underserved communities, like low-income and minority families. The intent of a “social bond” program is to highlight underlying lending activities that support these borrowers and promote greater equity in the mortgage market.
As part of this initiative, FHFA and the enterprises have developed a Social Index, which is a methodology for measuring socially oriented lending activity in a given pool of mortgages. It is designed to allow investors to identify pools with relatively high concentrations of loans that meet certain social criteria. Fannie Mae and Freddie Mac have started to publish single-family MBS disclosures based on this numerical rating system, and the goal is to potentially issue labeled, single-family social bonds in the near future.1 Ginnie Mae also recently announced that it would be adding social bond content to its single-family MBS prospectuses.2
The adjacent table—which was released in a Fannie Mae blog post in August 20223—shows the basic framework of the Social Index. On the right-hand side are eight social criteria that reflect various aspects of the enterprises’ housing mission, such as loans made to low-income borrowers or for property in a high-need rural area. These criteria are mapped into the three broad categories or dimensions shown on the left-hand side: income level, borrower attribute and property type and location.
Social Index Framework
| Dimensions | Criteria |
|---|---|
Dimensions Income |
Criteria Low Income Borrowers |
Dimensions Borrower |
Criteria Underserved minoritiesFirst-time homebuyers |
Dimensions Property |
Criteria Low-Income AreasMinority Tract High Needs Rural Designated Disaster Area Manufactured Housing |
The Social Index has two components, or pool-level values: the Social Criteria Score (SCS) and the Social Density Score (SDS). Fannie Mae published a useful illustration of how these scores are calculated. The illustration, shown below, describes the scoring for a stylized pool with ten loans. The SCS is simply the share of the mortgage pools’ underlying loans that meet any of the 8 social criteria. In the example below, 9 out of the ten loans meet at least one social criteria, so the SCS is 90 percent.
The SDS is a measure of the concentration of socially oriented lending activity in the mortgage pool. It captures the potential layering of social attributes in a given loan by answering the question: for each of the 3 social dimensions of income, borrower, and property, are any of the related social criteria met? It then assigns a value to each loan of between 0 (no dimensions satisfied) and 3 (all 3 dimensions satisfied). In the example below—which was provided by Fannie Mae—the first loan (loan #1) was made to a first-time homebuyer with the property in a low-income area. In this case, 2 out of the 3 social dimensions are met—borrower attribute and property location—so the loan-level score is 2. The average value across all of the 10 loans would be the SDS, which in the example below is 1.5.
Social Criteria (90.0% SCS)
| Social Criteria | 1 | 2 | 3 | 4 | 5 | 6 | 7 | 8 | 9 | 10 |
|---|---|---|---|---|---|---|---|---|---|---|
Social Criteria Low-Income Borrower |
1 0 |
2 1 |
3 0 |
4 0 |
5 0 |
6 1 |
7 0 |
8 0 |
9 1 |
10 0 |
Social Criteria Minority Borrower |
1 0 |
2 0 |
3 1 |
4 0 |
5 0 |
6 0 |
7 1 |
8 0 |
9 0 |
10 0 |
Social Criteria First-Time Homebuyer |
1 1 |
2 1 |
3 0 |
4 0 |
5 1 |
6 0 |
7 0 |
8 0 |
9 0 |
10 0 |
Social Criteria Designated Disaster Area |
1 0 |
2 0 |
3 0 |
4 0 |
5 1 |
6 0 |
7 0 |
8 0 |
9 0 |
10 0 |
Social Criteria Low-Income Area |
1 1 |
2 0 |
3 1 |
4 0 |
5 0 |
6 0 |
7 0 |
8 0 |
9 0 |
10 0 |
Social Criteria Manufactured Housing |
1 0 |
2 1 |
3 0 |
4 1 |
5 0 |
6 0 |
7 0 |
8 1 |
9 0 |
10 0 |
Social Criteria High-Needs Rural |
1 0 |
2 1 |
3 0 |
4 0 |
5 0 |
6 0 |
7 0 |
8 0 |
9 1 |
10 0 |
Social Criteria Minority Tract |
1 0 |
2 0 |
3 1 |
4 1 |
5 0 |
6 0 |
7 0 |
8 0 |
9 0 |
10 0 |
Social Criteria Criteria Met Indicator1 |
1 1 |
2 1 |
3 1 |
4 1 |
5 1 |
6 1 |
7 1 |
8 1 |
9 1 |
10 0 |
Social Dimensions (1.5 SDS)
| Social Dimension | 1 | 2 | 3 | 4 | 5 | 6 | 7 | 8 | 9 | 10 |
|---|---|---|---|---|---|---|---|---|---|---|
Social Dimension Income |
1 0 |
2 1 |
3 0 |
4 0 |
5 0 |
6 1 |
7 0 |
8 0 |
9 1 |
10 0 |
Social Dimension Borrower |
1 1 |
2 1 |
3 1 |
4 0 |
5 1 |
6 0 |
7 1 |
8 0 |
9 0 |
10 0 |
Social Dimension Property |
1 1 |
2 1 |
3 1 |
4 1 |
5 1 |
6 0 |
7 0 |
8 1 |
9 1 |
10 0 |
Social Dimension Loan-level Score2 |
1 2 |
2 3 |
3 2 |
4 1 |
5 2 |
6 1 |
7 1 |
8 1 |
9 2 |
10 0 |
1 Indicates if a loan met any of the eight criteria
2 Loan-Level Score is the sum of the three Social Dimension Scores
Home Mortgage Disclosure Act Evidence for Credit Unions
The National Credit Union Administration’s Office of the Chief Economist (OCE) has used the general framework and criteria of FHFA’s Social Index to evaluate the social attributes of mortgages originated by credit unions in 2022. OCE has used loan-level data released in the 2022 Home Mortgage Disclosure Act (HMDA) database.4 That database can be used to produce summary statistics for loans originated by financial institutions regulated by different supervisory agencies. This enables comparisons between credit unions and other financial institutions.
Table 1: Social Criteria Score1
| Summary/Social Dimensions | Credit Unions2 | All Others |
|---|---|---|
Summary/Social Dimensions Number of Institutions |
Credit Unions2 1,423 |
All Others 2,849 |
Summary/Social Dimensions Total Number of Loans |
Credit Unions2 398,750 |
All Others 4,137,681 |
Summary/Social Dimensions Income |
Credit Unions2 27.0% |
All Others 26.1% |
Summary/Social Dimensions Borrower |
Credit Unions2 27.2% |
All Others 32.2% |
Summary/Social Dimensions Property |
Credit Unions2 28.1% |
All Others 30.3% |
Summary/Social Dimensions Social Criteria Score |
Credit Unions2 56.0% |
All Others 58.9% |
1 2022 HMDA, 3/31/2023 datasets. Originated first-lien, purchase and refinance loans on single-family, primary-residence homes.
2 Includes filers with agency = 5 (NCUA), NFICUs, CUSOs, a Puerto Rico cooperativa, and credit unions under joint NCUA/CFPB supervision in 2022Q4.
OCE’s findings suggest that credit unions, overall, originated loans with a somewhat smaller SCS in 2022 than non-credit unions.5 As Table 1 below indicates, among first-lien mortgages for single-family, primary-residence homes, 56.0 percent of credit unions’ originations satisfied at least one social criterion associated with the Social Index, compared with 58.9 percent for non-credit unions. Details for the various social dimension (income, borrower,6 and property)7 shares suggest that credit unions had slightly higher representation along the income dimension, with 27.0 percent of credit union mortgage loans in our sample originated to low-income borrowers, compared with 26.1 percent for non-credit unions. The “borrower” and “property” dimension shares, however, were higher for non-credit unions.8
Table 2 shows the SCS shares for mortgages submitted under each of the HMDA filing agencies. In general, loans originated by the regulated entities of the Federal Deposit Insurance Corporation (FDIC), the Board of Governors of the Federal Reserve System (Fed), the Office of the Comptroller of the Currency (OCC), and the CFPB9 tended to have lower aggregate SCS scores than loans originated by credit unions. The SCS shares of Department of Housing and Urban Development (HUD)-filing institutions—generally non-depository institutions—were much higher than for other institutions in our analysis.
Table 2: Social Criteria Score by Agency1
| Summary/Social Dimensions | OCC | Fed | FDIC | Credit Unions2 | HUD | CFPB |
|---|---|---|---|---|---|---|
Summary/Social Dimensions Number of Institutions |
OCC 430 |
Fed 308 |
FDIC 1,170 |
Credit Unions2 1,423 |
HUD 826 |
CFPB 115 |
Summary/Social Dimensions Number of Loans |
OCC 172,522 |
Fed 119,432 |
FDIC 359,023 |
Credit Unions2 398,750 |
HUD 2,731,174 |
CFPB 755,530 |
Summary/Social Dimensions Income |
OCC 27.6% |
Fed 27.1% |
FDIC 25.9% |
Credit Unions2 27.0% |
HUD 26.4% |
CFPB 24.3% |
Summary/Social Dimensions Borrower |
OCC 21.7% |
Fed 21.0% |
FDIC 20.9% |
Credit Unions2 27.2% |
HUD 35.5% |
CFPB 29.8% |
Summary/Social Dimensions Property |
OCC 24.5% |
Fed 28.4% |
FDIC 26.7% |
Credit Unions2 28.1% |
HUD 32.7% |
CFPB 25.1% |
Summary/Social Dimensions Social Criteria Score |
OCC 50.3% |
Fed 51.0% |
FDIC 50.0% |
Credit Unions2 56.0% |
HUD 62.3% |
CFPB 53.9% |
1 2022 HMDA, 3/31/2023 datasets. Originated first-lien, purchase and refinance loans on single-family, primary-residence homes.
2 Includes filers with agency = 5 (NCUA), NFICUs, CUSOs, a Puerto Rico cooperativa, and credit unions under joint NCUA/CFPB supervision in 2022Q4.
Table 3 below summarizes originations by SDS, showing shares of originations that met one or more social dimensions of the framework (income, borrower, property). For credit unions, of the 56.0 percent of originations that satisfied at least one social dimension, 34.6 percent satisfied one, 16.4 percent two, and 5.0 percent all three dimensions. These shares were somewhat higher for non-credit unions; for these other institutions, the shares were 35.2 percent, 17.6 percent, and 6.1 percent, respectively.
Table 3: Share of Loans by Social Density Score1
| Social Density Score2 | Credit Unions3 | All Others |
|---|---|---|
Social Density Score2 0 |
Credit Unions3 44.0% |
All Others 41.1% |
Social Density Score2 1 |
Credit Unions3 34.6% |
All Others 35.2% |
Social Density Score2 2 |
Credit Unions3 16.4% |
All Others 17.6% |
Social Density Score2 3 |
Credit Unions3 5.0% |
All Others 6.1% |
1 2022 HMDA, 3/31/2023 datasets. Originated first-lien, purchase and refinance loans on single-family, primary-residence homes.
2 Range: 0-3.
3 Includes filers with agency = 5 (NCUA), NFICUs, CUSOs, a Puerto Rico cooperativa, and credit unions under joint NCUA/CFPB supervision in 2022Q4.
HMDA Evidence for Credit Unions of Different Sizes
Next, OCE looked at credit union originations by asset size.10 As Table 4 below demonstrates, among the HMDA-filing institutions, the largest credit unions tended to have originations with higher SCS and higher average SDS than their smaller counterparts. For instance, credit unions with at least $10 billion in assets at the end of 2022 had an overall SCS of 59.2 percent for applicable loans, compared with 54.7 percent for credit unions with assets between $1 billion and $10 billion, and 54.6 percent for credit unions smaller than $1 billion. Similarly, the average SDS for originations of credit unions in the largest asset group, at 0.86, exceeded those of their smaller counterparts.
Table 4: Social Criteria Score and Social Density Score by Credit Union Size1
| Credit Union Size | Number of Institutions2 | Social Criteria Score | Average Social Density Score3 |
|---|---|---|---|
Credit Union Size >$10 Billion |
Number of Institutions2 21 |
Social Criteria Score 59.2% |
Average Social Density Score3 0.86 |
Credit Union Size $1 Billion - $10 Billion |
Number of Institutions2 398 |
Social Criteria Score 54.7% |
Average Social Density Score3 0.80 |
Credit Union Size < $1 Billion |
Number of Institutions2 988 |
Social Criteria Score 54.6% |
Average Social Density Score3 0.82 |
Credit Union Size Credit Union Aggregate |
Number of Institutions2 1,407 |
Social Criteria Score 56.0% |
Average Social Density Score3 0.82 |
Credit Union Size Non-Credit Union Aggregate |
Number of Institutions2 2,849 |
Social Criteria Score 58.9% |
Average Social Density Score3 0.89 |
1 2022 HMDA, 3/31/2023 datasets. Originated first-lien, purchase and refinance loans on single-family, primary-residence homes.
2 Credit union aggregates are for credit unions only and include NFICUs and credit unions under joint NCUA/CFPB supervision in 2022Q4. Assets are based on 2022Q4 Call Reports.
3 Range: 0-3.
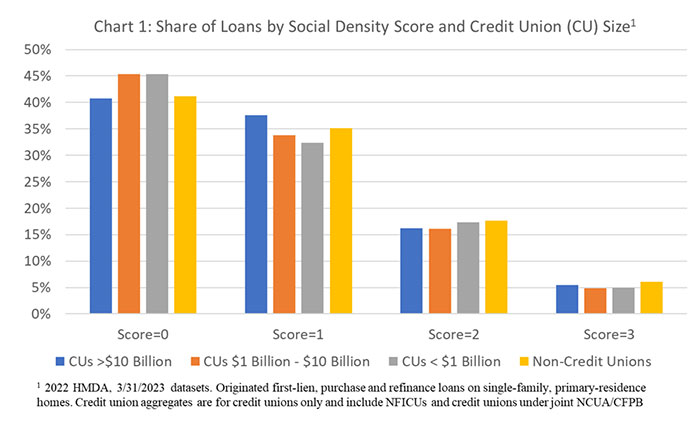
When looking further into the SDS scores, OCE found that the largest credit unions’ higher SDS score was primarily attributable to a larger share of loans that met exactly one of the three dimensions. As shown in Chart 1 below, 37.6 percent of mortgages originated by the largest credit unions satisfied one SDS dimension, compared with 33.8 percent and 32.4 percent of loans originated by smaller credit unions (between $1 billion and $10 billion and less than $1 billion in assets). Scores of “2” and “3” were not especially common for loans originated by all credit union size groups or non-credit unions. Credit unions only had between 4.8 and 5.4 percent of their loans satisfy all three dimensions; other institutions had a marginally higher share of about 6.1 percent.
Conclusion and Caveats
The Social Index used in this research note provides one framework for analyzing the extent to which financial institutions, including credit unions, may be serving socially beneficial purposes through their mortgage lending. OCE’s analysis generally shows that, within the confines of the social criteria outlined in the framework, credit unions exhibit mixed results. Credit unions trail HUD-regulated entities—generally non-depositories—in their Social Criteria Scores, but tended to have higher scores than banks regulated by the FDIC, the Fed, and the OCC. The analysis also suggests that larger credit unions, overall, tended to have higher scores than their smaller credit union counterparts.
It is worth noting that the choice of different social criteria than the ones used in this particular index could yield different results and paint a different picture of credit union lending compared to other financial institutions.11 Furthermore, credit unions are also constrained by their field of membership. A measurement framework might take into account those constraints when summarizing mortgage lending activity.
There were also data limitations associated with the use of HMDA, the only available source for this type of analysis. For instance, the HMDA data captured only about 30 percent of all credit unions, although that group represented 90 percent of total industry assets. Moreover, many smaller credit unions are not included in this analysis due to HMDA’s 2022 filing exemption for institutions with assets of less than $50 million.12
Finally, the rating system used in this analysis measures social attributes of loans at origination, but it does not provide information on the ultimate success or financial health of the mortgage borrower. It is possible that a loan could “score” high in terms of social criteria met but might not be sustainable or the specific loan terms might prove to be less than optimal. Assuming the availability of data, an alternative set of measures could be deployed to account for such longer-term factors.
1 See FHFA’s request for information on its social bond program This is an external link to a website belonging to another federal agency, private organization, or commercial entity. here (Opens new window) . Fannie Mae and Freddie Mac already issue multifamily social bonds. In 2021, both enterprises also started to issue single-family “affordable bonds,” which contain loans originated under their respective affordable loan programs (for example, Freddie Mac’s Home Possible program). However, the enterprises have not yet issued dedicated, labeled single-family social bonds.
2 See HUD press release here. Investors can use this information to determine if Ginnie Mae MBS meet their requirements for a social bond. According to Ginnie Mae, the targeted borrower attributes for social bond characterizations include low-to-moderate income individuals, veterans, senior citizens, members of rural communities and/or tribal, Alaska Native and Native Hawaiian communities.
3 See This is an external link to a website belonging to another federal agency, private organization, or commercial entity. https://www.fanniemae.com/research-and-insights/perspectives/proposed-methodology-single-family-social-disclosure (Opens new window) .
4 The HMDA data used were the March 31, 2023, agency data released by Consumer Financial Protection Bureau. Beyond HMDA data, the analysis also employed the FHFA’s 2022 This is an external link to a website belonging to another federal agency, private organization, or commercial entity. Low-Income Areas File (Opens new window) , This is an external link to a website belonging to another federal agency, private organization, or commercial entity. 2022 Rural Areas File (Opens new window) , This is an external link to a website belonging to another federal agency, private organization, or commercial entity. 2023 Rural Areas File (Opens new window) (for colonia flag only), and the NCUA’s 2022Q4 Call Report dataset.
5 In this paper, for expository simplicity, “credit unions” refer to HMDA-filing credit unions and credit union service organizations (CUSOs), unless otherwise noted. These institutions include those reporting HMDA data under agency=5 (NCUA), non-federally insured credit unions (NFICUs), CUSOs, a Puerto Rico cooperativa, and This is an external link to a website belonging to another federal agency, private organization, or commercial entity. credit unions under joint NCUA/CFPB supervision in 2022Q4 (Opens new window) . Also included were five credit unions that erroneously filed under the incorrect agency.
The following loan filters were applied to the original This is an external link to a website belonging to another federal agency, private organization, or commercial entity. HMDA dataset (Opens new window) to obtain the dataset used for the analysis: action type=1 (originated loan); loan purpose=1, 31, or 32 (home purchase, refinance, cash-out refinance); occupancy type=1 (principal residence), lien=1 (first lien), total units=1 (single-family). The following data formatting modification was made: income originally not reported in thousands, as required, was modified by dividing by 1,000 to correct. In addition, loans with missing or unavailable information required for any of the criteria analysis (for example, missing income, applicant race, among others) were dropped, as complete loan information was needed to definitively evaluate each loan. For dimensions with multiple criteria, each criterion was tested first and the loan with missing data was dropped only if the available data did not qualify the loan.
6 Minority applicant/co-applicant is defined as one with race/ethnicity combination other than non-Hispanic White ( This is an external link to a website belonging to another federal agency, private organization, or commercial entity. race-1=5 (Opens new window) , This is an external link to a website belonging to another federal agency, private organization, or commercial entity. ethnicity-1=2 (Opens new window) ).
7 All but one criteria of the index include a borrower household income limit. The household income—as proxied by the income reported on the loan application (HMDA)—is compared to the area median income as reported by FHFA (MEDINC variable in the This is an external link to a website belonging to another federal agency, private organization, or commercial entity. 2022 Low-Income Areas File (Opens new window) ).
8 The HMDA data do not have a flag indicating first-time homebuyer (FTHB) status of the borrower and thus the resulting statistics are unable to capture that element of the Social Index. An evaluation of loan-level data in the National Mortgage Database—a smaller database, but one that has FTHB status—suggests that credit unions may have lower representation of first-time homebuyers than other originators.
9 All credit unions—including those jointly supervised by NCUA/CFPB and those that erroneously filed under the incorrect regulator—are included in the “credit union” category for this analysis.
10 For the purposes of this analysis, institutions were limited to credit unions only, including 19 NFICUs and 19 credit unions under joint NCUA/CFPB supervision in 2022Q4. Assets are based on 2022Q4 Call Reports.
11 The This is an external link to a website belonging to another federal agency, private organization, or commercial entity. background on the index methodology (Opens new window) published by Fannie Mae stated that “the Social Index is flexible, and the underlying criteria can be adjusted based on market feedback and as the focus of single-family social lending evolves.”
12 1,452 credit unions filed the 2022 HMDA. These institutions represented 30 percent of all credit unions in 2022, but over 90 percent of total credit union assets. Institutions with assets of $50 million or less as of December 31, 2021, were exempt from collecting data in 2022.